Computer graphics program in Python and C++
Python
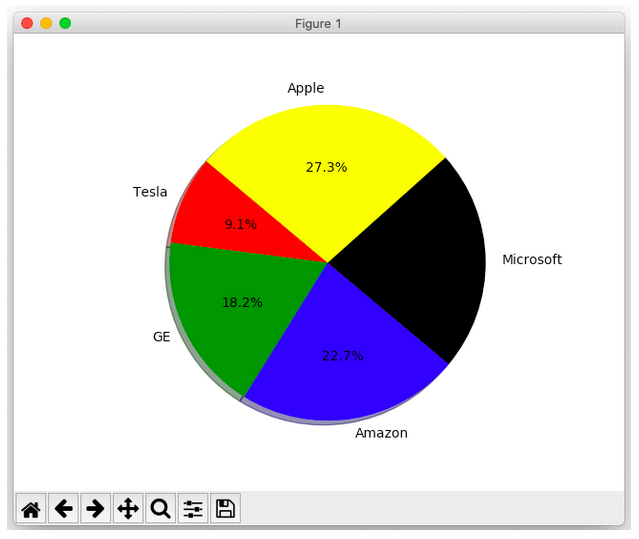
import matplotlib.pyplot as plt

# Data to plot
# labels = 'Python', 'C++', 'Ruby', 'Java'
# sizes = [215, 130, 245, 210]
# colors = ['gold', 'yellowgreen', 'lightcoral', 'lightskyblue']
# explode = (0.1, 0, 0, 0)  # explode 1st slice
n = int(input("Enter No. of elements: "))
labels = list(map(str, input("Enter list of labels: ").split()))
sizes = list(map(int, input("Enter list of sizes: ").split()))
colors = list(map(str, input("Enter list of colors: ").split()))
explode = [0]*n

# Plot
plt.pie(sizes, explode=explode, labels=labels, colors=colors,
autopct='%1.1f%%', shadow=True, startangle=140)

plt.axis('equal')
plt.show()
C++
#include<bits/stdc++.h>
#include<graphics.h>
#include<conio.h>
using namespace std;
int main(){
int gd = DETECT, gm;
initgraph(&gd, &gm, " ");
int mx = getmaxx() / 2;
int my = getmaxy() / 2;
int n;
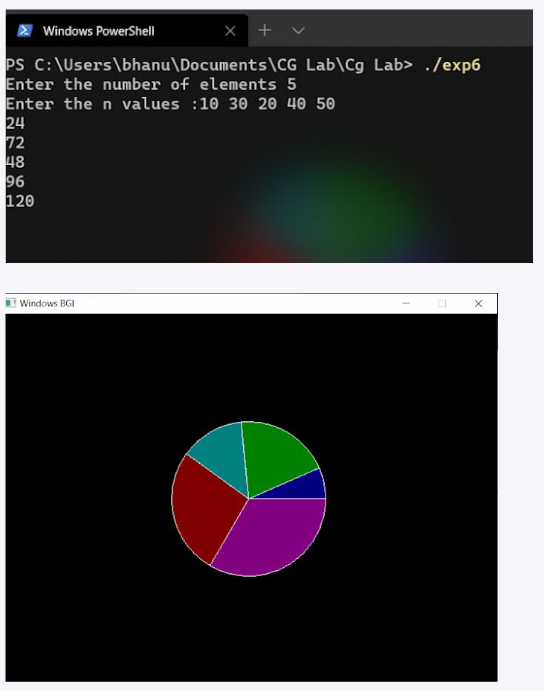
cout<<"Enter the number of elements ";
cin>>n;
vector<int> a(n);
int s = 0;
cout<<"Enter the n values :";
for(auto &i: a) {
cin>>i;
s += i;
}
double last = 0;
for(int i=0;i<n;i++){
double angle = ( (double)a[i] / (double)s) * 360;
cout<<angle<<"\n";
setfillstyle(SOLID_FILL, i+1);
pieslice(mx, my , last, last + angle, 100);
last += angle;
}
getch();
closegraph();
return0;
}


")


